VERSION LONGUE NON ILLUSTRÉE ET NON PUBLIÉE
Color Pulsed Doppler Imaging into History of Science as Dynamic Frameworks
Notes from Vesalius to Pourcelot via Harvey
Jean-François Moreau[1]
Paris Descartes University, France
Raffaele Pisano
Lille University, France
raffaele.pisano@univ-lille3.fr
Jean-Michel Correas
Necker University Hospital Paris, France
jean-michel.correas@nck.aphp.fr
Abstract
Meanwhile progress in physiology were developing, the progress in printing developed in Germany under the contradictory influences of Newton and Goethe.
Contemporary printers, even performing offset, use chromolithography by four colors (cyan, magenta, yellow and black) to colorize the drawings, especially of the anatomy's books (i.e. Bourgery's treatise). Under the influence of Malpighi, the oxygenated aortic blood has been colored in red, the cava venous system in blue, the lymphatic system is in purple or white, the nerves are in yellow. This due to the natural difference in darkness of both the arterial and the venous bloods of the alive mammalians.
Color Doppler real-time digital ultrasound is the only medical imaging technique using blue and red coding for cardiovascular hemodynamics even though this doesn't rely on oxygen blood saturation. The ultrasonic probe recollecting the echoic waves plays the role of the heart. In red the wave figures the blood flow is coming to the probe, the blue wave is centrifuge: the lighter the color, the faster the flow. Heterogeneous structures may result from the aliasing phenomenon.
Pulsed Doppler ultrasound allows the vision of the blood flow curve. Artefacts by the sonographer malpractice are current causes of misinterpretation of intrinsic/extrinsic syndromes. Dopplerists only thinkDoppler's language. In order to qualify and to quantify abnormalities of the blood flow, gaseous echoic contrast media made of microbubbles have been recently introduced. Similarly, microdoppler enables the approach of very distal vessels and evidences quasi microscopic vasculature inside tumors looking avascular macroscopically or pseudo-cystic cavities.
In our paper we present an intellectual history of imagining as a dialogue between historical foundations of science and medical frameworks.
1. An Outline
Historical epistemology of science (such as part of the history of science) is one of the possible approaches to understanding the history and philosophical of science combining, i.e., historical/epistemological aspects (primary sources, historical hypothesis, shared knowledge, epistemological interpretations) and using logical and mathematical inquiring. For example: what are physics and mathematical objects in a theory? How are they linked? Historians and philosophers of science-sometime with high levels of training in the exact sciences and sometime without such technical expertise-have deployed a wide variety of approaches (internal and external, disciplines, foundations, construction and negotiation of theories, experimental practices, etc.) and interpretive frameworks (the structure and consequences of networks, research sites, histories of technologies and wider cultures, etc.). The point has been reached at which historians and philosophers of the exact sciences can benefit from critically assessing feedback from the history of their own historical, epistemological and philosophical research. In other words, the community of historians and philosophers of the exact sciences can now undergo a learning process, grounded in their own collective experience. But, how to do this? Where is an adequate audience among international book-publishers and journals? How can we compare and assess historiographical and philosophical approaches and perhaps choose or design one type in preference to others?Such questions would exist in any area of historical, epistemological and philosophical research, but they become very pointed when thinking about the practice of the history and philosophy of exact sciences. It is granted that rigor and fruitfulness characterize the theoretical and experimental dimensions of the exact sciences, as well as their organization and modes of quality control. Is anything similar to this possible in historical inquiry; in particular how constrained are historical propositions and theses by what counts as their internal evidential bases? However, despite all this, it still seems relevant to seriously question if we now know enough about the actual dynamics of research in the exact sciences; and because of historical and philosophical investigations, can we begin to think in terms of the similarities and analogies between such research and the activities? Furthermore, what about the output of historians and philosophers, especially historians of science? Certainly, those involved in the micro-politics of scientific work have suggested as much (humankind, critical judgement, rhetoric and the disciplinary interactions, etc.). These reflections raise the possibility that reflection on what has been found out about science dynamics through work in the history of the exact sciences may be translated to further improve the practice of that history/historical/epistemology/historiography. There is, of course, a problem in that the kinds of historical and philosophical work are, for many scholars, a source of skepticism concerning the possibilities of human knowledge and inquiry. Even so, it seems quite feasible that common ground can be found to redeem the rationality, fruitfulness and progress of both the exact sciences. These have all stressed the importance of the use of historical/epistemological categories for inquiry and interpretation exact sciences in the past. What does the history of these attempts, and the history and philosophy of the wider historiography of the sciences, suggest about surpassing the clash of these programs and the merely piecemeal accretion of individual studies of the exact sciences?[2]
2. A Short Introduction
Ultrasound is mechanical energy in the form of vibrations that propagate through a medium such as tissue. Ultrasound interacts with tissues by undergoing absorption, reflection, refraction, and scattering and produces an image representative of tissue structure. Imaging artifacts can be recognized and understood based on a knowledge of the principles of ultrasound[3].
2.1 On Color Pulsed Doppler as Scientific Phenomenon
The technology of Color Pulse Doppler[4] is adapted to the majority of either linear or convex probes equipping most of the ultrasonographic apparati on sale for the so-called "radiological" practice. Phased array probes are devoted to cardiology. The module encompasses two different sources of settings: a) a system clock enables the setting of both the sample depth and the sample length connected to the gate fed by b) the oscillator producing the ultrasound beam (from 1MHz to 24 MHz) going to be amplified toward a mixer and a processor after the operator has set the sample volume; the acoustic signals are both dispatched either to headphones as a noise and/or to a cathode-ray tube as a curve and/or a colored signal; the latter is visualized after it has passed through a Fast Fourrier Transform analyzer[5] (Fig. 1). The optimal setting encompasses a sample depth taking the full lumen of the vessel (carotid artery) or its center (cardiac cavities, aorta) (Fig. 2 & 3); the shorter the sample depth, the better. Like for all ultrasound beams used in medical practice, gaseous and metallic interfaces hamper more or less the visualization of echoes expected to be significant[6]. In order to prevent the artefacts induced by the phenomenon of aliasing, the operator has to set the pulse repetition frequency (PRF) in order to suppress the lowest peaks of frequency[7] (Fig. 4).
Figure 1.  Spectral analysis. The time is subdivided in
frames set by the PRF (pulse repetition frequency).
Spectral analysis. The time is subdivided in
frames set by the PRF (pulse repetition frequency).
Figure 2 a & b:  Carotid artery 1 and Jugular vein 2 during a Valsalva maneuver with
intrathoracic hyperpressure. a) Conventional computer coding (artery in red,
vein in blue). b) Reverse coding of the similar image (have a look at the scale
logo exhibited at the up and right angle). Take note that the artery has
parallel margins; the vein is dilated during the Valsalva but the upper distal
tip is narrowed.
Carotid artery 1 and Jugular vein 2 during a Valsalva maneuver with
intrathoracic hyperpressure. a) Conventional computer coding (artery in red,
vein in blue). b) Reverse coding of the similar image (have a look at the scale
logo exhibited at the up and right angle). Take note that the artery has
parallel margins; the vein is dilated during the Valsalva but the upper distal
tip is narrowed.
Figure 3.  Ultrafast doppler of the carotid
artery (1) and of the jugular vein (2).
Normal pattern.
Ultrafast doppler of the carotid
artery (1) and of the jugular vein (2).
Normal pattern.
Figure 4.  Aliasing. The highest frequencies (1) induce
their replication below the medial line (2) and multiple turbulences on the
color doppler.
Aliasing. The highest frequencies (1) induce
their replication below the medial line (2) and multiple turbulences on the
color doppler.
2.2. On Color Pulsed Doppler as Social Phenomenon
Color Duplex Doppler appears in all diagnostic strategies of medical syndromes involving the cardiovascular system as an intrinsic disease (e.g. atheroma, phlebitis) or a lesion encompassing a vascular component such as a neovascularity (e.g. tumors, abscesses). Provided that the transductor or the probe are applicable to the skin for a cutaneous scanning or the mucosa by endoscopy, there is no contraindication and the technology is non-invasive. The major weakness of color pulse doppler is its operator-dependence. Pitfalls are more often related with wrong technique than misinterpretation of a curve or an image by the operator producing false positive or false negative diagnoses. The latter is reliable when an interpretable image is forwarded to the practitioner but the report of the sonographist and its conclusion are more important for the patient care. Mutual confidence is the key for a worthwhile examination.
On the other hand, more and more often, the whole examination or the diagnostic sequences are recorded on CD-roms. This is useful for the follow-up of the lesions. Printing the essential sequences on paper requires an eclectic choice of the images and a perfect setting of the photocopier, either in Polaroid or other media reproducing the shades of the RGB trichromacy (red, green, blue) or, if this is an offset printer, those of the CMYB tetrachromacy (cyan, magenta, yellow, black).
2.3. The Structure of the Paper
Studies (1704) and controversies (1810) on human chromatic perception invested Isaac Newton (1642-1727) and Johann Wolfgang von Goethe (1749-1832). On the other side, except on blackboards and positive X-Ray films, scientists used shades of grey-blood vessel walls in black and the lumen in white or conversely. The first plates are in de Humani corporis fabrica[8] (1543) by anatomist Andreas Vesalius (1514-1564) but the anatomists had become reliable after the publication of Exercitatio anatomica de motu (1628) by physiologist William Harvey (1578-1657). Apart from the 18thcentury, both color printing and anatomo-physiology developed parallelly to provide the reliable support to the education and the practice of doctors and surgeons. In 1895, the discovery of X-rays had a deep influence on the medical activity but it boosted anatomy and physiology all along the 20thCentury specially with the computed radiology. However, radiology is an invasive technique and ultrasonography has appeared as a prototype of disruptive technology because of its non-invasiveness. Even digitalized, the arteriography is a heavy procedure. Doppler ultrasound mainly when this is associated with color duplex doppler has become a valuable tool even it too much operator dependent for the clinical study of the systemic cardio-vasculature. Contrary to the colored anatomy of the arteries and the veins exhibited in books and treatises that is artefactual, the doppler images are natively colored in red and blue although this isn't related with the oxygen saturation of the blood. When one has understood the significance of the color indices in anatomo-physiology, including color doppler, the other uses are more cosmetic than scientific, in CT and MRI specially.
3. An Early Account in the Antiquity
Since their origins, the humans have tried to acquire the knowledge of the anatomy and of the physiology of their body. Hippocrates of Kos (ca. 460 BC-ca. 377 BC) was the first "physician" in the history of humanity; he founded the fundamentals of the clinical medicine; he learnt anatomy on the battlefields but his manuscripts were not illustrated by pictures of the body whether it was normal or abnormal.
A decisive advance was promoted by the school of Alexandria headed by Herophilus (ca. 330 BC - ca. 260 BC) and Erasistratus (ca. 315 - ca. 240 BC) under the dynasty of the mighty Ptolemaio Pharoahs. The Egyptians who were experts in mummification had the right to practiced autopsies of cadavers and may be vivisection; whether illustrated or not, their manuscripts were burnt during the fire of the Library of Alexandria ordered by the Christian Roman Emperor, Theodosius the Great (347-395). Later on, the autopsies were prohibited for centuries in the whole Western world even in pagan societies. So, Galen of Pergamum (129 AC - ca. 200 - ca. 216 AC) whose philosophic activity was performed mainly in Roma, remained the reference in anatomo-physiology of the humans during more than one millennium. His literature was based on unreliable animal data inapplicable to humans until the Italian school of medicine decided to cancel the prohibition of autopsy of the human cadavers. During that long period of time, there was no illustration of the human body available for scientific purpose.
4. Vesalius and the Wood Engraving
The development of the modern science of anatomy highly relies on the inventions of the paper exported from China to Damascus and of the printing by Gutenberg (1400-1468). Now let you imagine somebody using a sheet of white paper, he can picture a piece of the body with a black pencil; this is the principle of positive illustration; conversely a teacher using a blackboard can draw the same piece with a white piece of chalk, featuring the negative view in photography extended to radiology. The first great anatomist was Andreas Vesalius of Padua (1514-1564); his major contribution to anatomy is the "fabrica"[9], an opus made of five volumes, the third volume of which is dedicated to the vessels and to the nerves of the body. The illustration in black on a white background were printed with a technology termed wood engraving (Fig. 5).
A similar technology was used by the printers of the opus by Charles Estienne[10] (1504-1564) and Bartholomaie Eustachi[11] (1521-1574); both authors ignored the modern physiology of the heart. Later, the anatomists took advantage of a new technology called etching using a plaque of copper that gives softer and more precise plates; the illustration provided by the anatomo-physiologist Albrecht von Haller[12] (1708-1777) reaches a kind of perfection (Fig. 6).
Figure 5:  Venae cavae and their branches by Andreas
Vesalius. The liver is huge and the heart is little.
Venae cavae and their branches by Andreas
Vesalius. The liver is huge and the heart is little.
Figure 6:  . Dissection of the right upper
neck by Albrecht von Haller.
. Dissection of the right upper
neck by Albrecht von Haller.
5.William Harvey and Marcello Malpighi: the Hemodynamics and the Color Encoding
These earliest modern anatomists were wrongly influenced by Galen[13]. The highlight came from a physician from the Saint-Bartholomew Hospital of London, William Harvey[14] (1578- 1657) who stated in 1628:
It has been shown by reason and experiment that blood by the beat of the ventricles flows through the lungs and heart and is pumped to the whole body. (Harvey [1628]1928, XIV [p. 58] p 103, op. cit.)
The evidence of distal arteriovenous shunts was demonstrated by Marcello Malpighi (1628- 1694) using the newly available microscope invented controversially in 1625 by Galileo Galilei[15] (1564-1642); Malpighi, discovering the red cells of the blood, featured the arteries in red and the veins in blue[16]; however the official colors of the pulmonary vascularization from both right atrium and ventricle to the chest through the pulmonary artery are more exactly colored in blue since the blood is coming from the venae cavae; the latter is full of carbaminohemoglobin while the pulmonary veins are full of oxyhemoglobin and colored in red like the left atrium and the left ventricle and the aorta.
Since the chemical mechanism of the hemoglobin cycle was unknown at that time, this is likely Malpighi, looking at the red cells, made his choice according to the colors of the blood observed by bleedings, gleaming red in the arteries of the aortic system, much darker in the cava one.
6. Isaac Newton and Jacques-Christophe Le Blon: the Trichromacy Etching
In the late 17th Century, Isaac Newton[17] (1643-1727) introduced his theory of the solar light studied by prisms based upon the colors of the rainbow[18] (Fig. 7).
Figure 7.  The first representation of Newton's spectrum
to be printed in color by Gautier d'Agoty (Observation sur l'histoire naturelle,
1752).
The first representation of Newton's spectrum
to be printed in color by Gautier d'Agoty (Observation sur l'histoire naturelle,
1752).
Nevertheless, taking into account the historical epistemology on shared science knowledge in context, previous studies were proposed on light diffraction as described on the basis of experiment, and first named by Francesco Maria Grimaldi (1618-1653), a Jesuit in Bologna. His studies on light are to be found in his posthumous book[19]. Grimaldi's work was mentioned in the first edition of Newton's Opticks[20] (1704) based on lectures written down between 1674 and 1679. Later on, however, Newton came to other conclusions; he formulated his own corpuscular theory on the nature of light in contrast to Grimaldi's wave interpretation. Therefore, the word "diffraction" disappeared in the second edition of Opticks dated on 1718 and in the other following ones being substituted by "inflection", i.e a bending of corpuscules the light is made of[21].
A German printer, Jacques-Christophe Le Blon (1667-1741) was inspired by Newton's theory and invented the etching in trichromacy[22] based upon the red, the blue and the yellow colors, both latter producing the green (Fig. 8). His main Dutch fellow was Jan L'Admiral (1699-1773) who reproduced a famous etching of a heart (Fig. 9 a & b). Le Blon's trichomacy was enhanced by Jacques Fabien Gautier d'Agoty (1716-1785), a French anatomist, painter and printmaker who ended the procedure by an application of black ink (Fig 10 & 11). Paul Mascagni (1752-1815) published the most achieved plates in color printed with that technique[23].
Fig 8.
Figure 9 a & b. 
 Reconstruction
of the heart using trichromacy etching by Jan L'Admiral.
Reconstruction
of the heart using trichromacy etching by Jan L'Admiral.
Figure 10.
Figure 11:  Typical etching by Gautier d'Agoty exhibiting
the myology of the left arm, the vessels of the left breast and the anatomy of
the abdomino-pelvic cavity in a woman. Take note of the aorto-iliac arterial
trunk in red and the iliac veins at the origin of the inferior vena cava in
blue.
Typical etching by Gautier d'Agoty exhibiting
the myology of the left arm, the vessels of the left breast and the anatomy of
the abdomino-pelvic cavity in a woman. Take note of the aorto-iliac arterial
trunk in red and the iliac veins at the origin of the inferior vena cava in
blue.
7. Godefroy Engelmann and the Chromolithography towards the Offset Printing.
The three contemporary authors already cited in our bibliographic list, De Montmollin[24] et al., and Rodary[25] and Mollon[26], do not mention a third technological stage in the development of etching based on tetrachromacy applied to lithography on limestones[27]. The reason might be because their earliest promotors didn't act as illustrators of anatomical books. The pioneer in 1792 was a German printer called Aloys Senefelder[28] (1771-1834). He was followed in 1815 in France by Charles Philibert de Lasteyrie du Saillant[29] (1759-1849). In 1836, Godefroy Engelmann[30] (1788-1839) introduced the chromolithography in tetrachromacy (cyan, magenta, yellow, black) still used nowadays; the latter is the first step of what it will become the offset printing one century later[31].
The treatise of Jean-Baptiste Marc Bourgery[32] (1797-1849), is considered by the international experts as the most impressive book ever published in the field of anatomy; it was co-authored and illustrated by Nicolas-Henri Jacob (1782-1871). The first edition was printed on lithography in tetrachromacy (Fig.11). The recent reedition by Le Minor and Sick at Taschen[33] is printed in offset like most of the contemporaneous publications[34] (Fig. 12).
Figure 11. Retroperitoneal space and the upper
urinary tract on chromolithography according to Bourgery and Jacob. Take note
of the thin slice of fat surrounding both kidneys, so important in
radiodiagnosis.
Retroperitoneal space and the upper
urinary tract on chromolithography according to Bourgery and Jacob. Take note
of the thin slice of fat surrounding both kidneys, so important in
radiodiagnosis.
Figure 12.  The retroperitoneal space according to Pernkopf
(1888 -1955) in the 2nd edition printed by offset in 1980. Take note
of the nerves colored in yellow and of the lymphatic vessels and nodes in
white.
The retroperitoneal space according to Pernkopf
(1888 -1955) in the 2nd edition printed by offset in 1980. Take note
of the nerves colored in yellow and of the lymphatic vessels and nodes in
white.
Whatever the technology of engraving used, the arteries are conventionally colored in red and the veins are colored in blue in the pictures exhibiting the great circulation and conversely if this is the pulmonary circulation. The choice is less exclusive in the case of the lymphatic vessels and lymph nodes (white or yellow or even purple) and in that of the nerves (white or yellow or black).
7. An Historical Epistemological Intermezzoon Goethe and Newton's Theory of Colour
In Germany, a known scientific-philosophical controversy rode during the end of the 18thcentury and the beginning of the 19th versus the birth of German Romanticism at the end of 19th century. Particularly, it debated-conserved some crucial aspects of the late German Enlightenment (i.e., Sturm und Drang, 1765-1785 inspired to Wirrwarr's drama, published by Maximilian Klinger in 1776). Deep scientific and epistemological-philosophical arguments arising on these issues, so exerting a profound influence on some great thinkers, e.g., Johann Wolfgang von Goethe, Friedrich Wilhelm Christian Carl Ferdinand Freiherr von Humboldt (1767-1835) and Friedrich Heinrich Alexander Freiherr von Humboldt (1769-1859) who - analysing Kant's writings - produced, by different tones, a new philosophical conceptual vision of man so different from the previous century. These changes, in some manner, had a certain inspiration, as well as on, generally speaking, the epistemic kind of development of science and related technology along 19th century[35].
The scientific vision of nature, typically of the Enlightenment (i.e., within Newtonian paradigm[36]), was no more satisfactory for the new German Romanticism thinkers (i.e., Goethe). On the other hand, to the theses of empiricism and the reduction of phenomena to mechanical phenomena, the philosophy of nature (or, epistemology, or theory of knowledge, depending of the country) contrasted the ideas of holismand monism. From holism, the epistemic knowledge of the whole cannot be given by knowledge of the individual parts that compose it, but it is only possible as intuitive knowledge thus contrasting himself to the atomistic analysis of empiricism. In agreement with this vision of nature, as a single organism endowed with a principle of self-organization, then the living species were no more considered like a part of an immutable path-chain, but rather such as indexes of the same substance in continuous transformation.
According to Goethe, the World would perennially renew itself through continuous metamorphoses of organic forms. This new natural conception was performed within new prospective of epistemological and philosophical analysis (e.g. organicism, vitalism, finalism, spiritualism, dialectics, among other scientific frameworks at that time).
Goethe also studied anatomy within the debate, at the time, on the presence or absence of the intermaxillary bone in humans. Many considered the absence of this bone as a characteristic of differential element of man's nature compared to other animals, under certain aspects, similar to him. Very interesting (but also attributable to other anatomists of the past) was his application of a comparative method of analysis. It allowed him to conclude that, in similar organisms,
a) It is possible to find similar structures.
b) The bones of the skull would be due to modifications of vertebral structures. This need to seek a deep unity in the variety of living organisms.
In German context, another important example of the explanation of mechanisms was perception, more deeply, the color theory. The debate was focused on Newton's Opticks(1704). Goethe, on his side, suggested that a mathematical method surrendered too much the prosperity of the natural phenomena and by his Zur Farbenlehre (Theory of Colours[37]) exactly disputed the paradigm of the Newtonian mechanistic explanation of natural phenomena, like the case study of seeing applied to the colors; in terms of the mechanical properties of the corpuscles. Goethe attempts to refute the so-called Newton's experimentum crucis. (Fig.13)
- Finding of the retina, simultaneously, in different circumstances and opposed to this forced by light and darkness;
- Light and darkness, operate each in specific way;
- Each of these two poles has the eye in two different states causing them either maximum receptivity, in the case of darkness, or maximum tension, in the case of light;
- This observation is based on the experience that each of us can have by quickly passing by a room strongly illuminated to a dark one: for a certain time, the vision it is prevented.
-
By means of this epistemic pattern (among others), Goethe suggested his own theory of colors as an opposite result of the observation made through a prism which, in his opinion, represented the demonstration of the fallaciousness; a sort of experimental inaccuracy of Newton's theory (Fig.12). Nevertheless, later on he used it: projected versus wall in order to expected to see a spectrum of colors. Instead, the wall appeared to his eyes completely white, without trace of color. The only exception was the point where a clear area bordered with a dark one. Therefore, Goethe concluded that, in order to see the spectrum of colors, a kind of a borderline was necessary; that is a point/line where light and darkness met, giving so live to the colors.
We also remark Goethe's scientific weakness (with respect to Newton[38]) to conceive a theory of colors: he, considered absurd to think that the white light could be composed of darker lights, and that an indivisible element - that is the light - could be thought as composed of rays and beams
Figure 13.  Castel's[39] 1740 comparison of
Newton's spectral color description with his explanation in terms of the
interaction of light and dark, which Goethe later developed into his Theory
of Colours.
Castel's[39] 1740 comparison of
Newton's spectral color description with his explanation in terms of the
interaction of light and dark, which Goethe later developed into his Theory
of Colours.
By means of his observations, he also noted that, passing through a prism, a ray of light does not break down in the Newtonian spectrum, but it produces colored fringes at the edges of a black and white pattern. Thus, he was solicited to think that the color is the product of a black and white pattern of lines and points, and that the different colors are the mere result of different proportions of black and white. Thus, as above mentioned, Goethe's observations were the product of the unaware defilement of the accurate physical experimental conditions; In 1853, the physicist Hermann von Helmholtz[40] (1821-1894) showed that in order that light is composed by means of a spectrum, a beam of light must be precisely addressed through the prism in a completely dark environment. Instead, Goethe erroneously allowed to several beams of light to enter. Thus, the latter produces a lot of overlapping spectra and the result is, as Newton argued, a white light. In fact, looking at the naked eye through the prism, one can see black and white shapes. They are the result of a type of optical aberration that afflicted the first few inaccurate microscopes: the images, in fact, were distorted by colored fringes on the contours of the object observed. This chromatic distortion well known by the lens manufacturers could, evidently, to be unknown to Goethe. Let us see what Goethe exactly did.
Goethe started his light experiments, as above mentioned, using erroneously a prism and did not repeat the same experimental conditions. He limited himself to the observations of vast surfaces, ignoring the light reflected at every point on the wall was decomposed, but the colors decomposed on a large surface were mixed again reproducing white: only at the edges of large surfaces, in fact, it is possible to see the spectrum bright. Continuing to experiment, he discovered that, observing surfaces of uniform color, one could see the colors of the spectrum appear at the edges of the figures. He then drew a black strip on a white background and he realized that on the border between the white background and the black strip, looking at the prism, one could see the spectrum appear. By means of these observations, he concluded that the color was produced by the encounter of black and white through a process of contamination of white by the black and that, therefore, the colors they were generated by black. The premises from which Goethe left led him to incorrect conclusions on the phenomenon of color generation: from this point of seen Newton's theory proved unassailable.
Goethe, however, should be credited to have investigate the way in which the scientific contexts change the color sensations showing, in evident way, as the vision of the colors is a way of the organism, in particular visual system, to react to light stimuli coming from outside. He realized how - a given color is perceived differently a depending on the color of the background on which it is placed; one can observe three pairs of rhombus of the same color: green magenta, grey. Every element of the pair is placed on a different background (blue on the left and orange on the right). Also notice how, although the colors are in equal pairs, they are perceived as different in relation to the background on which they are placed (for example, the grey rhomb appears grey on the blue background and tending to bluish green on the orange background). Then, studying the shadows produced by brightly colored lights Goethe also realized how the eye tended to see shadows, for example, projected by a green light like strongly colored red: he discovered, therefore, that to the vision of a color the eye acts by dyeing the adjacent colors with its complementary (identifiable in Newton's color circle as his opposite). He, therefore, opposed the primary character of white light and the secondary character of the chromatic sensations. Thus, denying an abstract nature in light shows interest in the reconstruction of a physiology of vision that passes from the subjectivity of the perceiver. According to Goethe since the colour is indifferently related to light and darkness (the clear, white, and the dark, black) is their mixture (grey) that summarizes and blends all the other colors in itself. Within his theory, he explains that colors can be:
1. Physiological, as subjective colours whose sole intermediary is the subject perceiving them;
2.
Physical, as
subjective or objective colours of variable and transient intensity that is
obtained for
interposition of transparent or translucent bodies;
3. Chemical, as objective colors that are fixed on bodies and substances of different nature or are extracted from them.
He distinguished the colors as active (yellow, orange, red[41]) and passive (light blue, indigo, violet). For active colors, the brightness expands to the outside and, therefore, they are experienced as joyful and full of energy; for passive ones, instead, the shadow prevails because the light remains imprisoned in the interior. In addition, he intuited that the colors are an active reworking of who them perceives; they are strongly influenced by the psychological and historical context of the observer. For Goethe the perception alone does not allow us to grasp all the complexity and beauty of the nature: cannot be a distinction between the world of experience and the world of ideas, and colors exert a sensory action that cannot be detached by a moral action.
To sum, generally speaking, for Goethe, the color consists of light and darkness (white and black) and one cannot take into account only the physical characteristics of light.
8. Wilhelm Roentgen and the Radiology toward Medical Imaging
As a scientific discipline, the medical radiology was born immediately when, in September 8th1895, Wilhelm Conrad Roentgen (1845-1923)[42], who was a good photographer, discovered the X-rays which had impressed a photographic film by chance. He took the first picture of his wife's hand on a photographic film he developed like a photograph on paper. Roentgen could observe the organs presenting with four positive shades of grey from black to white (Fig.14):
1) Metals like gold and calcium are featured in black (opaque);
2) Hydric organs like viscera and muscles are in dark grey;
3) Fatty structures are in light grey;
4) Gaseous structures are in white (transparent).
Figure 14.  [UMO1] The first radiograph of Frau
Roentgen's hand 1. Black shade of gold 2. Black shade of bone calcium. 3. Dark
grey shade of muscle. 4. Light grey shade of fat. 5. White shade of the air.
[UMO1] The first radiograph of Frau
Roentgen's hand 1. Black shade of gold 2. Black shade of bone calcium. 3. Dark
grey shade of muscle. 4. Light grey shade of fat. 5. White shade of the air.
Many years later the radiologists have become used to examine their radiographs inspected on dedicated view boxes on the same but negative shades of grey from the white (opacity) to the black (transparency): the metals are featured in white, the gas are featured in black, the fat is in dark grey, the viscera are in light grey. The contrast of the radiograph varies upon the intensity of the X-ray beam and the sensitivity of the film like in photography using the sunlight. In order to increase the performances of the radiodiagnosis, several contrast media have been introduced to enhance either the gaseous contrast by injection of air or CO2 into cavities or dedicated spaces (transparency), or the metallic contrast by barium sulfate for the digestive tract or iodinated molecules for the blood and the cavities (opacity) (Fig 15 a & b).
Figure 15 a & b. 
 Abdominal aortography by the Seldinger
technique (catheterism of the right femoral artery and injection of iodinated
contrast medium). a) positive contrast (arteries in black); b) negative
contrast (arteries in white)
Abdominal aortography by the Seldinger
technique (catheterism of the right femoral artery and injection of iodinated
contrast medium). a) positive contrast (arteries in black); b) negative
contrast (arteries in white)
The human eyes cannot discriminate more than sixteen shades of grey[43] (Fig. 16 a & b).
Figure 16 (a & b). 

a) The four shades of grey visualized by conventional radiology on negative film and their corresponding organic matters. The computed coding allows to multiplicate the number of shades of grey in between both pure metal and air.
b) The human eyes cannot discriminate more than 16 shades of grey. Take note of the impossibility to discriminate the last couple of black shades on that file of 18 shades of grey: three distal black rectangles and circles and hexagons are compacted without possibility to discriminate them save the use of computer coding for densitometry. The series with different shapes of illustrates the phenomenon described by Felson as the silhouette sign's. The superimposed figures are well defined if they have different shades of grey. They black part of the scale is differentiated when the margin is printed in white (line of the stars). Take note also of the lack of visibility of the white shape when it is are printed on white backgrounds with an empty outline (lines of the circles and of the hexagons); the white rectangle is visible because it is outlined in black.
Using high resolution matrices (up to 2048x2048 pixels) the images obtained for digital angiography and Computed Tomography scanning[44](CT, at the beginning, termed tomodensitometry in France), but also magnetic resonance imaging (MRI) and conventional ultrasonography in real time are treated by informatics methods either in positive or negative visions of the scanned volumes of the body; the four fundamental shades of grey are subdivided in multiple shades of grey studied by densitometry according to the size of the matrix; for instance, on CT scanner, an hydric structure containing iron such as a vascularized tumor may have a spontaneous density of 75, a number that inflates when a bolus of iodinated compound is injected. Even though MR and ultrasonographic images are visualized with the same scales of grey than CT scan and digital angiography, their respective computer codings result from totally different physical fundamentals than the X-rays.
9. Léandre Pourcelot and the Color Doppler
The use of colored digital medical images provided on cross-sectional tomographic technologies (CT scan and MR and nuclear medicine) relies on aesthetic or educational purposes: they do not reflect scientific physiological images with one exception, that of colored ultrasonic doppler. The latter explores the hemodynamics all along the cardiovascular axes and their distal branches. The simple doppler provides a curve and a special noise according to the relationship between the direction of the blood flow and the axis of the ultrasonic probe. Pulse doppler quantifies the phenomenon mainly with the measurement of the resistive index of Pourcelot well correlated with the renal function and the serum creatinine level[45]. Léandre Pourcelot[46] (born in 1940) is a physician and an engineer in acoustics who, in 1965, introduced vascular doppler in Europe[47]. He had become famous when he participated in the cardiovascular follow-up of the cosmonauts and the astronauts traveling in the space via satellites[48]. Mostly under the influence of the Japanese industry, the pulsed color doppler has become colored by encoding using the RGB scale of Newton more often than the CMYB scale of Engelmann. When the axes of the ultrasonic beam and of the blood flow go in the same direction, the conventional encoding is in red colour; conversely, when they cross each other the conventional encoding is in blue.
According to the operator's hand manipulating the probe, an arterial blood flow may be colored in red or in blue; similarly, the venous blood flow expected to be colored in blue may be colored in red (Fig. 2 & 3). Such a duplicity often introduces misinterpretation of the vascular tree examined just on the picture by third persons. On the other hand, color doppler gives data on the speed of the blood flow: the faster the flow the yellower the light. For instance, in a case of stenosis of the trunk of a renal artery by a plaque of atheroma[49], one can see the red color of the aortic lumen and of the pre-stenotic part of the trunk and the brightly yellow part of the stenotic area because there is an acceleration of the blood flow featuring the phenomenon of aliasing (Fig. 17 & 18).
Figure 17 a, b, & c:  a & c) Atheromatous stenosis of the ostium
of the right renal artery (**) On the color duplex doppler, the aorta is
colored in red. The distal renal artery
is dilated and its computer coding is in blue. b) Take note of the hyperechoic
interface induced by the plaque and the posterior acoustic shadow (*). a &
b) There is an increase in velocity before and after the stenosis marked by
yellow encoding of the blood specially intense on the power doppler (b).
a & c) Atheromatous stenosis of the ostium
of the right renal artery (**) On the color duplex doppler, the aorta is
colored in red. The distal renal artery
is dilated and its computer coding is in blue. b) Take note of the hyperechoic
interface induced by the plaque and the posterior acoustic shadow (*). a &
b) There is an increase in velocity before and after the stenosis marked by
yellow encoding of the blood specially intense on the power doppler (b).
Figure 18.  Upstream (1) and downstream (2) turbulences in
a typical case of arterial hypertension induced by an atheromatous stenosis of
the right renal artery.
Upstream (1) and downstream (2) turbulences in
a typical case of arterial hypertension induced by an atheromatous stenosis of
the right renal artery.
10. Instances of Color Doppler Applied to Medical Diseases
Color Doppler is useful in the field of the tumor syndrome[50] (Fig. 19). The latter may be hyperechoic, isoechoic, hypoechoic or anechoic according to the ratio between solid components (benign or malignant tumors) and liquid components (cysts or pseudo-cystic tumors, necrotic and/or neo vascularized components) whether they are heterogeneous or not. Most of the time the benign cysts are anechoic with a posterior enhancement of the echoes. A dependent level of echogenic fluid can be observed in the abscesses. Necrotic malignant tumors may mimic benign cysts save they are surrounded by a thick and irregular vascularized wall. Color doppler is useful in order to demonstrate the presence of vascular echoes in the transparent mass in fact rich in anarchic vessels. However, it may happen a transparent solid mass looks like a cyst without signs of vascularity even if the intensity of the ultrasonic beam is increased because the intravascular flow is very slow almost immobile. In such a case, one takes advantage of the intravenous injection of contrast media made of gaseous microbubbles[51] (Fig 20). We could demonstrate the actuality of blood vessels in a case of multiple pseudo-cystic aneurysms of a kidney magnified by intratumor echoes produced by the microbubbles (Fig 21).
Another kind of pitfall may be induced by a defective scanning of the vessel. In such a case the sonographer creates a cloud of multiple colored spots trespassing the area of the vessel itself toward the surrounding soft tissues. Such a pitfall must be differentiated from the artefacts induced by a hyper-pulsatile vessel shaking the space every system.
Figure 19.  Isoechoic solid cancer of the upper pole of
the left kidney (1) looking vascularized at the color duplex doppler (2). The
mass is surrounded by a vascular halo (3) more visible on the power doppler
(3). The neovascularization of the mass is enhanced by the intravenous
injection of microbubbles (4). Take note of the normal permeability of the
renal vein below the mass.
Isoechoic solid cancer of the upper pole of
the left kidney (1) looking vascularized at the color duplex doppler (2). The
mass is surrounded by a vascular halo (3) more visible on the power doppler
(3). The neovascularization of the mass is enhanced by the intravenous
injection of microbubbles (4). Take note of the normal permeability of the
renal vein below the mass.
Figure 20.  Arterio-venous fistula (A) of the right
kidney. Take note of the turbulences (*) and of the permeability of the big
drainage vein (V).
Arterio-venous fistula (A) of the right
kidney. Take note of the turbulences (*) and of the permeability of the big
drainage vein (V).
Figure 21.  Visualization of the echolucent
ischemic renal cortex (1) in a case of total acute renal necrosis in an infant.
The sign is enhanced by the injection of microbubbles which opacifies the
vessels of the renal medulla (2) and of the surrounding liver. The scale of
colors expressing the time in seconds is made of the seven shades of the
rainbow.
Visualization of the echolucent
ischemic renal cortex (1) in a case of total acute renal necrosis in an infant.
The sign is enhanced by the injection of microbubbles which opacifies the
vessels of the renal medulla (2) and of the surrounding liver. The scale of
colors expressing the time in seconds is made of the seven shades of the
rainbow.
11. Conclusion
Studies (1704) and controversies (1810) on human chromatic perception invested Isaac Newton (1642-1727) and Johann Wolfgang von Goethe (1749-1832). On the other side, except on blackboards and positive X-Ray films, scientists used shades of grey-blood vessel walls in black and the lumen in white or conversely. Plates are in de Humani corporis fabrica (1543) by anatomist Andreas Vesalius (1514-1564) and Exercitatio anatomica de motu (1628) by physiologist William Harvey (1578-1657).
Printers have used chromolithography by four shades (cyan, magenta, yellow and black) to colorize the drawings of the anatomy's books since the 19th century. Apart from Malpighi (e.g. Bourgery's treatise), the oxygenated aortic blood has been colored in red, the cava venous system in blue, the lymphatic one is in purple or white, the nerves are in yellow. This due to the natural difference in darkness of both the arterial and the venous bloods of the alive human being.
Color Doppler real-time digital ultrasound is the only medical imaging technique using blue and red coding for hemodynamics, even if this doesn't reflect the O2blood saturation. The ultrasonic probe recollecting the echoic waves plays the role of the heart. In red the wave figures the blood flow coming to the probe, the blue wave is centrifuge: the lighter the color, the faster the flow. Heterogeneous structures induce the aliasing phenomenon.
Pulsed Doppler ultrasound allows the vision of the blood flow curve. Artefacts by the sonographer malpractice are current causes of misinterpretation of intrinsic/extrinsic syndromes. Dopplerists only think Doppler's language. In order to qualify and quantify abnormalities of the blood flow, gaseous echoic contrast media made of microbubbles are introduced intravenously.
In our paper, we present an intellectual history of imagining as a dialogue between historical foundations of science and medical frameworks.
[1]Corresponding author: Jean-François Moreau, 220 rue Carnot, F 59155 Faches Thumesnil, jf@jfma.fr, tel :+33-6-79110477.
[2]Adapted from an unpublished document written by Raffaele Pisano in collaboration with John Schuster (HPS Unit, Sydney University, Australia) for a round-table at the Lille 2015 Summer school, France.
[3] Joo Ha Hwang, Michael B. Kimmey. Principles of ultrasound. In: Robert H. Hawes, Paul Fockens, Shyam Varadarajulu, eds. Endosonography. Elsevier:Amsterdam, 2nded, 2011, p 2.
[4] In that chapter of a book dedicated to colors, we develop specially the color duplex doppler but there are many recent developments of other softwares providing a colored ultrasonography such as power doppler, microdoppler, ultrafast doppler, etc... Another ultrasonic technique, but not based on doppler effect, is elastometry which provides a colored image of the soft tissues according to the indices of stiffness of the normal and of the pathological patterns. See Jean-Michel Correas, Dany Anglicheau, Dominique Joly, et al. Ultrasound-based imaging methods of the kidney-recent developments. Kidney International 2016, 90/6: 1199-1205.
http://dx.doi.org/10.1016/j.kint.2016.06.042 acc. 05-12-2018.
[5] Peter NT Wells. Physics and bioeffects.In:John P. McGahan, Barry B Goldberg, eds. Diagnostic Ultrasound: a logical approach, New York, NY: Informa Healthcare, 2008, pp. 1-19.
[6] Olivier Hélénon, Jean-Michel Correas. Echographie et Doppler de l'appareil urinaire. In: Olivier Hélénon ed., Imagerie de l'Appareil Urinaire. Paris:Lavoisier Médecine Sciences:, 2nd ed, 2016, pp51-75.
[7] W. K. Chooi, Valdair Muglia, Peter L. Cooperberg. Artifacts. In: McGahan & Goldberg, (s.fn 5) p 20
Andreas Vesalius,. On the Fabric of the Human Body, translated by W. F. Richardson and J. B. Carman. 5 vols. San Francisco and Novato: Norman Publishing, 1998-2009. https://ceb.nlm.nih.gov/proj/ttp/flash/vesalius/vesalius.html, acc. 05-19-2018.
[9] Andreas Vesalius. De humani corporis fabrica libri septem. Basel : Ex officina Joannis Oporini, 1543.
[10] Charles Estienne. De dissectione partium corporis humani libri tres. Paris: Simonem Colinaeum, 1545.
[11] Dominique De Montmollin, Michael Schlups, Michel Schmidt. L'illustration anatomique de la Renaissance au siècle des lumières. Patrimoine de la bibliothèque publique et universitaire de Neufchatel. Neufchatel Switzerland :Bibliothèque Publique et Universitaire, 1998, p 35..
[12] Albrecht Von Haller. Elementa physiologiae corporis humani. Neapoli: Vincentium Ursinum, 1773. See also DeMontmollin, (S. fn.11) pp 63-67.
[13] De Montmollinet al. (s. fn, 11) pp 35-67.
[14] William Harvey. Exercitatio anatomica de motu cordis et sanguinis in animalibus. 1628 & The Anatomical Exercise Concerning the Motion of the Heart and Blood in Animals. 1753.
[15] Raymond J Seeger. Men of Physics: Galileo Galilei, His Life and His Works. Amsterdam:Elsevier, 2016, p 24.
[16] John D Mollon. The origins of the modern color science. In:Steven K Shevell ed. The science of color. 2nd ed. OSA Elsevier:Amsterdam, 2003, pp 2-32. See also: https://www.universalis.fr/encyclopedie/marcello-malpighi/, acc. 05-19-2018.
[17] Isaac Newton. Opticks: Or, A treatise of the Reflections, Refractions, Inflections and Colours of Light. London, UK:Smith & Walford, 1704
[18] John D Mollon. (s. fn, 16) p3
[19] Francesco Maria Grimaldi. Physico mathesis de lumine, coloribus, et iride, aliisque annexis libri duo. Bologna, Italy: Vittorio Bonati, 1665, pp. 1-11.
[20] Newton, (s. fn. 17).
[21]A Mottana, G Ferraris, M Brunori. The centennial of X-ray diffraction (1912-2012). Academia Nazionale Lincei Rendiconti Fisica. 2013:24, S1-S5.
[22] Jacques Christophe Le Blon. Colorritto or the Harmony of Colouringin Paaintings: reduced to Mechanical Practice under Easy Principles, and Infaillible Rules. London, 1704 (bilingual english/french) https://library.si.edu/digital-library/book/colorittoharmon00lebl, acc.16 May 2018
[23] De Montmollin et al. (s.fn. 11) pp. 75-89.
[24] De Montmollin (s.fn. 11). pp 1-89.
[25] Florian Rodary. Anatomie de la couleur. L'invention de l'estampe en couleur. Paris & Lausanne:Bibliothèque Nationale de France & Musée Olympique de Lausanne:, 1996, pp. 1--151
[26] John D Mollon. (s. fn. 16) pp 2-10.
[27] Jean E Bersier. La gravure : les procédés, l'histoire. 4e éd. Paris:Berger-Levrault, 1984. 430 p.
[28] Aloys Senefelder. The Invention of Lithography. , New York:The Fuchs & Lang Manufacturing Company, 1911.
[29] http://data.bnf.fr/12214261/charles-philibert_de_lasteyrie/ acc. 05-18-2018.
[30] Michael Twyman.Images en couleur, Godefroy Engelmann, Charles Hullmandel et les débuts de la chromolithographie, Paris:Éditions du Panama :Lyon, musée de l'Imprimerie, 2007.
[31] https://www.britannica.com/technology/offset-printing. Acc. 05-18-2018.
[32] Jean-Baptiste M Bourgery, Nicolas H Jacob. Traité complet de l'anatomie de l'homme comprenant la médecine opératoire. Avec planches lithographiées d'après nature par H. Jacob. Suppléments par Duchaussoy., Paris:Delaunay, 1832-1854. 8 Volumes.
[33] Jean-Marc Bourgery, Nicolas H Jacob: Atlas of Human Anatomy and Surgery. JM Le Minor, H Sick eds. Köln:Taschen, 2015.
[34] Eduard Pernkopf, Helmut Ferner (ed.), Harry Monsen (transl.). Atlas of Topographical Applied Human Anatomy. Urban & Schwarzenberg:Baltimore-Munich, 2nd ed., Vol 2., 1980. See also: David J Williams. The History of Eduard Pernkopf's Topographische Anatomie des Menschen. Journal of Biocommunication. Spring 1988. 15 (2), pp. 2-12.
[35] For example: Thermodynamic, electricity, electromagnetism, mathematics, the role of mechanics in other disciplines, celeste mechanics, analytical mechanics, statistical mechanics, etc.
[36] Raffaele Pisano, Paolo Bussotti. A Newtonian Tale Details on Notes and Proofs in Geneva Edition of Newton's Principia. BSHM-British Society for the History of Mathematics., 31/3, 2016, pp. 160-178.
[37] Johann W Goethe, Theory of Colours, trans. Charles Lock Eastlake. Cambridge, MA: MIT Press, 1982.
[38] Raffaele Pisano, Paolo Bussotti. The fiction of the Infinitisimals in Newton's Works: On the Metaphoric use of Infinitesimals in Newton. Isonomia, special issue, 9, 2017, pp. 139-158.
[39] Louis-Bertrand Castel. L'Optique des couleurs. Paris, 1740. https://en.wikipedia.org/wiki/Theory_of_Colours. acc. 05-14-2018.
[40] Hermann von Helmholtz. Handbuch der physiologischen Optik. Leipzig:Voss, 1867. http://lhldigital.lindahall.org/cdm/ref/collection/color/id/10550. acc. 05-10-2018.
[41] Four colors (yellow, orange, red, black) are used to image the signals in the technique of power doppler (see Fig. 17, b and Fig.19, 3 & 4).
[42] Wilhelm C Roentgen. Fundamental contributions to the X-ray: the three original communications on a new kind of ray / Wilhelm Conrad Roentgen, 1972. Bethesda:Modern Manuscripts Collection, History of Medicine Division, National Library of Medicine., MD; MS C 71, 1972.
[43] Benjamin Felson. Chest Roentgenology. Localization of intrathoracic lesions. Philadelphia, PA: WB Saunders Company; 1973. pp. 22-38. See also: Roy Longuet, James Phelan, Helene Tanous, and Stewart Bushong. Criteria of the Silhouette Sign. Radiology, 122-3, 1977, https://doi.org/10.1148/122.3.581 acc. 04-30-2018.
[44] Godfrey N Hounsfield. Computed medical imaging. Nobel lecture, December 8, 1979. J Comput Assist Tomogr. 4 (5), 1980, 665-74. See also: Ralph J Alfidi, John Haaga, Thomas F Meaney et al. Computed Tomography of the Thorax and Abdomen; A Preliminary Report. Radiology, 117-2, 1975. https://pubs.rsna.org/doi/10.1148/117.2.257acc. 05-19-2018.
[45] RI = peak systolic velocity - end diastolic velocity / peak systolic velocity. The measurement is optimal when it is performed on a corticomedullary artery of the kidneys. https://radiopaedia.org/articles/renal-arterial-resistive-index acc. 056-12-2018.
[46] https://fr.wikipedia.org/wiki/L%C3%A9andre_Pourcelot acc. 05-18-2018
[47] Léandre Pourcelot, Jacques Descotes, Effet Doppler et mesure du débit sanguin. C R Acad Sc. Paris, 261, 1965, pp. 253-256.
[48] Léandre Pourcelot, Jean-Marie Pottier, Philippe Arbeille, et al. Étude de la fonction cardiovasculaire chez les astronautes (mission STG 51 G - juin 1985). Bulletin De l'Académie Nationale De Médecine, 170, nos 3-4, 1986, pp. 341-344.
[49] Olivier Hélénon, Jean-Michel Correas, Sylvain Poirée, Lotfi Hendaoui. Imagerie de la pathologie vasculaire du rein. In:Hélénon, (s. fn. 6) pp. 407-422.
[50] Olivier Hélénon, Jean-Michel Correas, Samuel Merran, Nicolas Grenier. Imagerie des tumeurs malignes du rein. In:Hélénon, (s.fn.6) pp 280-305.
[51] Correas et al. (s.fn. 4) pp 1208-1210.
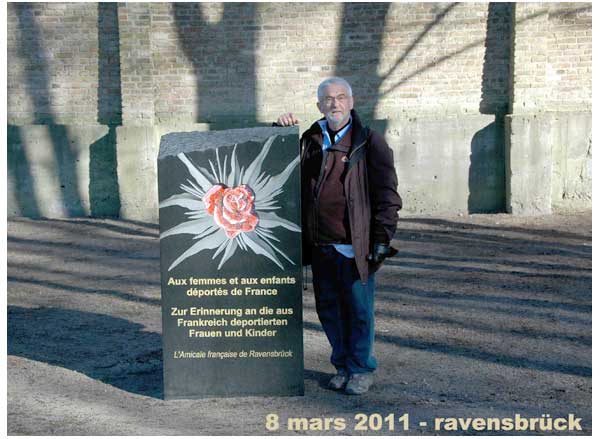
A RAVENSBRÜCK
LA PHARMACIE DE MARGUERITTE CHABIRON
A VERDELAIS ETAIT DANS CET IMMEUBLE
LES RESISTANTES S'ENFUIRENT PAR LE JARDIN A PIC